In a previous post we raised the question of why so little effort made by the British to document the number of
casualties caused by the invasion and occupation of Iraq? The
Chilcot Report provides evidence that the British government had a neglectful
and reckless attitude to the issue of civilian casualties. Two bullet points in the executive summary of the report* provide a damming verdict.
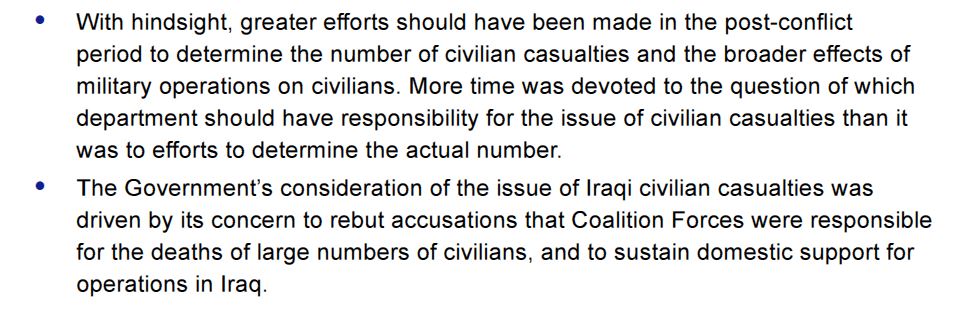
*[p29, Executive Summary]
The lack of
effort put into monitoring casualties meant that the information
required for assessing the performance of the British Government in its role as an occupying power was
simply not available. As Chilcot describes, the focus of their efforts was driven by concern
to avoid the impression that Coalition Forces were responsible for large
numbers of deaths, rather than to find out if this were indeed true.
As an occupying power, Britain had a legal responsibility under the Hague Convention and the Geneva Conventions to restore and ensure, as far as possible, public order and safety, and public health standards. Given the failure to monitora core indicator of public health in a post-invasion context, i.e. violent deaths, it seems hard to imagine that Britain was taking reasonable steps to fulfil its legal obligations. This dereliction of legal duty should be considered as a possible basis for legal action against the British Government and/or individuals within it..
Update 11/07/2016: Britain's failure to fulfil its obligations to protect the economy of Iraq from pillage have also now been raised. The door for prosecution of Blair and others under the Hague and Geneva conventions now seems very open.