
Period covered: Oct 2001 - Dec 31st 2014
UK military fatalities: 453
UK military injuries and illness: 15,459
Total UK casualties: 15,912
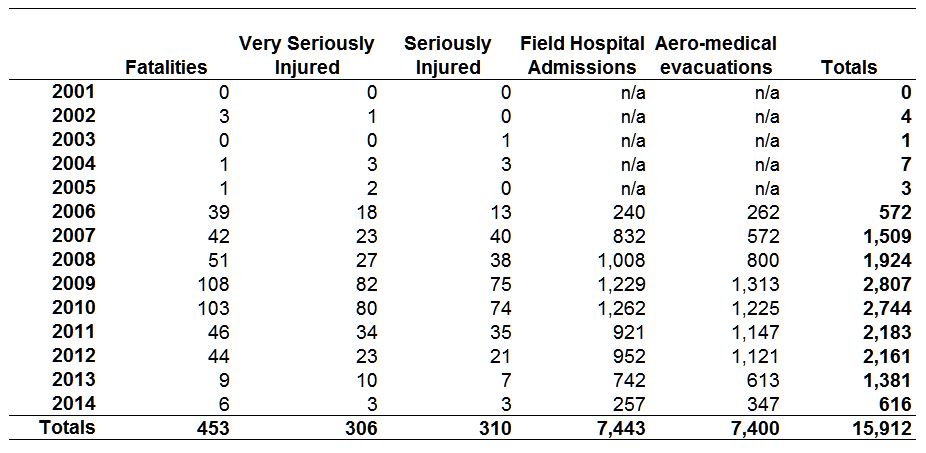
Source: Ministry of Defence
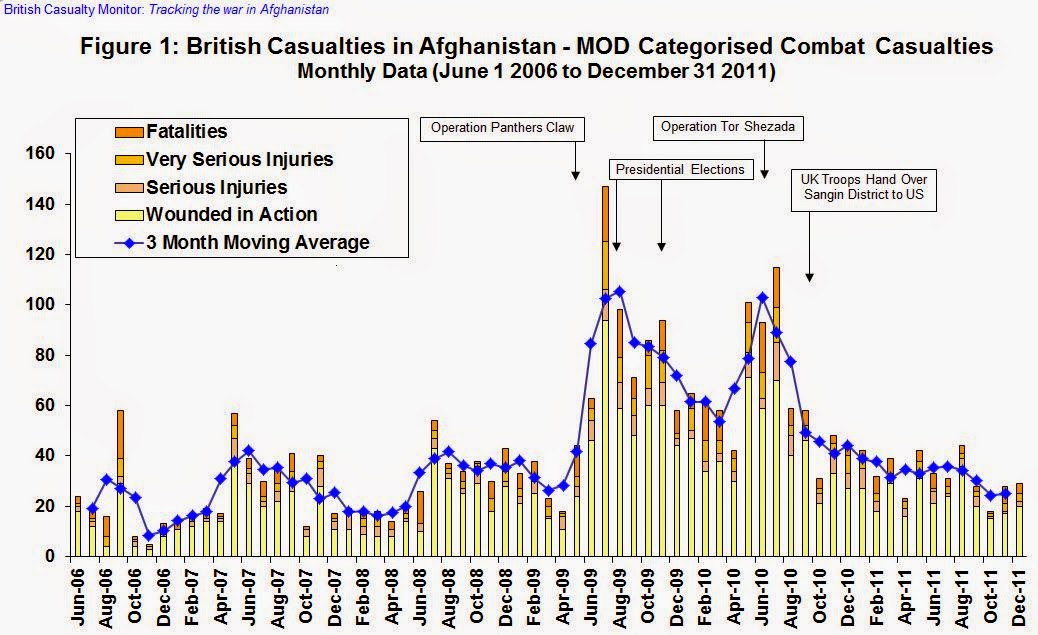
The first chart provides a monthly breakdown of casualties officially recorded by the MOD as being due to direct action, i.e. fighting. The 3 month moving average indicates the trend in combat casualties. As information was only made available on a monthly basis by the MOD from April 2006, the figures are shown from this date onwards.
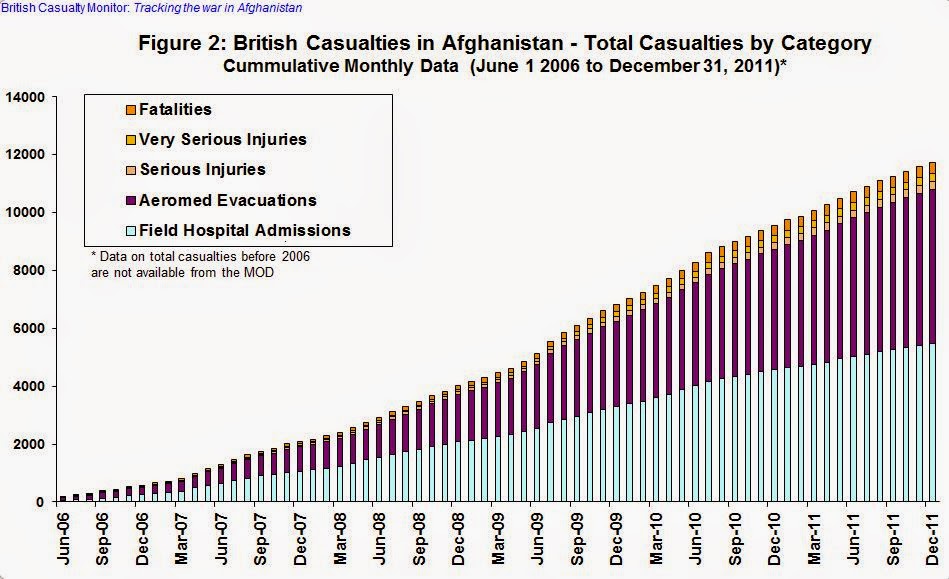
The second chart shows the figures for total casualties reported by the MOD. Due to the way the figures are presented in the MOD reports, it is impossible to be sure whether, and to what extent, double counting may be occurring. For example, soldiers admitted to field hospitals may also be classified as serious or very seriously injured, and could also, in principle, be counted in the aero-medical evacuation figures. However, from the publicly available data it is just not possible to know and we therefore present the sum of the different categories. As such, the figures represent the upper range of the official total casualty count. Nonetheless, the data illustrate that since the beginning of 2006 until the end of 2011, total casualties may have been over 7,000.
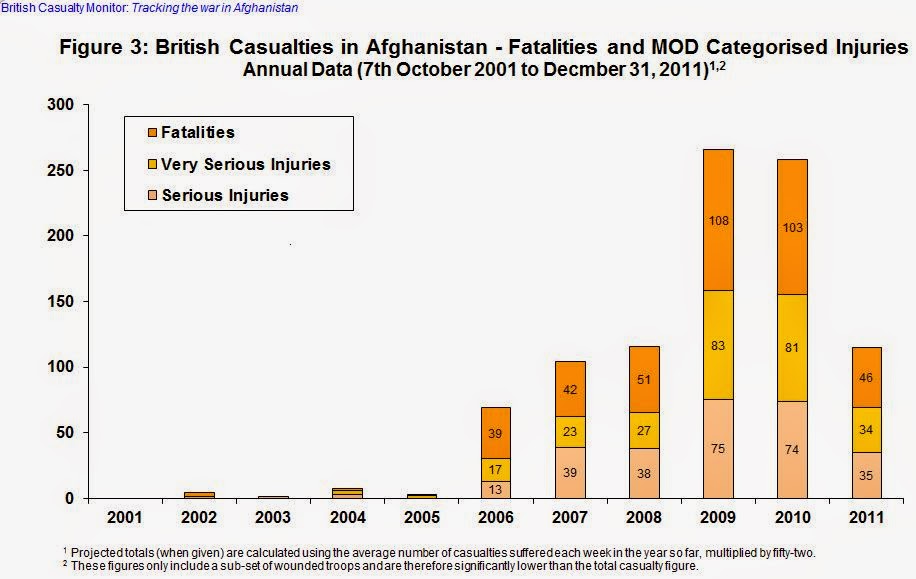
The third chart summarises the available data on fatalities and serious injuries since the war began in October 2001 until 2011. A very low level of casualties is seen following the invasion until 2006, when the conflict and British involvement significantly escalates.